Lisa
Video tutorial
About
Transcriptional regulators (TRs), including transcription factors and chromatin regulators, play central role in gene regulation, and are essential in many biological processes. To rank TRs given geneset, we develop a computational biology framework, Lisa, to evaluate and rank TRs effect by integrative modelling of chromatin landscapes and cistromes from Cistrome Data Browser (CistromeDB). To run Lisa online application or local command line, the only thing you need is the differential gene set derived from differential gene expression analysis of microarray and RNA-seq. Then you will be able to leverage the power of the most comprehensive TR ChIP-seq, DNase-seq, H3K27ac ChIP-seq database to discover the underlying regulatory TRs.
Lisa combines two models, epigenetics landscape in silico subtraction model and the cistrome regulatory potential model. The first model integrates epigenetics landscape with cistromes through in silico deletion strategy. First, the model will build a chromatin landscape model using the input gene set based on the comprehensive database of DNase-seq, or H3K27ac ChIP-seq. The model selects a subset of the cell type specific chromatin landscape. Then, the model will probe the effect of TRs on a gene in these landscapes by simulating deletions of chromatin signals on TR binding sites. These binding sites can come from the ChIP-seq experiment-derived data in CistromeDB, or the motif scan, or imputed TR binding sites from DREAM challenge. The second model uses only cistromes to model the TR regulatory potential on each gene. Finally, Lisa would assign every binding site profile(ChIP-seq data, motif hit profile or imputed TF binding site) a score showing essentiality of the set of transcriptional regulator binding sites by comparing the effect between all the input genes and a fixed/user-customized background genes, and combined all the statistics from both models for each TR.
Online version
Online Usage
The input fields and options is shown in the input interface(Figure 1). User can input one or two gene set by using RefSeq ids or gene official symbols, usually the two gene sets can be obtained from up and down-regulated gene set from a differential gene expression analysis,and select the species the gene set originates from, for example, here are two gene sets for MYC knockdown in brain tumors: up-regulated gene set, and down-regulated geneset. If one gene set is given, it should be placed in "Gene Set 1", and the TF ranking list of that one gene list would be provided. If two are given, an additional figure of comparison between the two gene set analysis will be generated, a typical scenario would be input up and down regulated gene set from a set of expression profiles, the label for each gene set can be customized optionally. For gene set size, we would recommend 50 to 500 genes, since few genes will lower the predictive power of chromatin profile modelling. To build a model that can best represent the cell type specific chromatin landscape, the number of genes can not be too few. By default, Lisa samples 3000 background genes for comparison, user can also specify customized background gene set. However, because in-silico deleting binding sites are time-consuming step for all the ChIP-seq profile and motif hit profile for all the input genes, the Lisa running time would suffer from the number of genes when it goes beyond 3000. By using the default backgroudn gene set based on TAD and promoter activity, we prepared a set of transcription factor perturbation experiments used as benchmarks in the paper (see in Human/Mouse Gallery). In addition, user can select method based on TR ChIP-seq peak, based on in-silico knockout method, or both. A single run takes 5-10 minutes depending on the size of the gene set, user can optionally set an email to receive the result link.

Online output
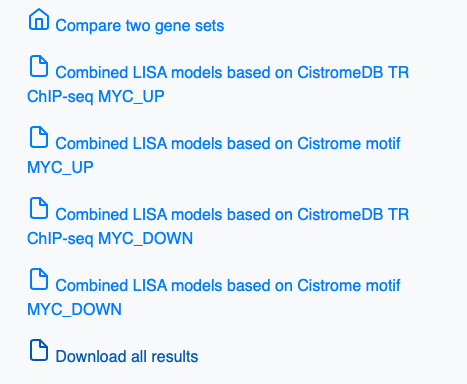
With two gene sets input, the MYC knockdown demo outputs the page, which lists the following results as in Figure 2:
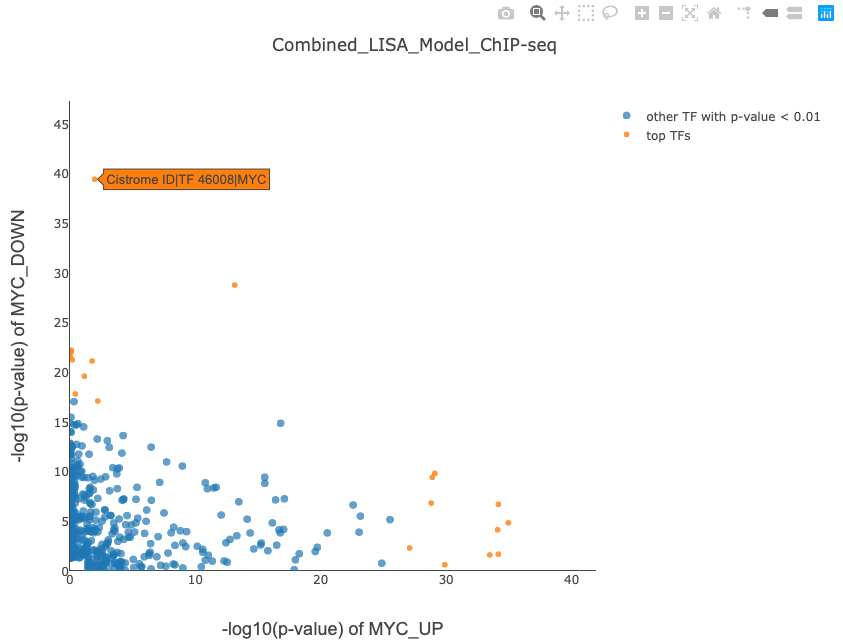
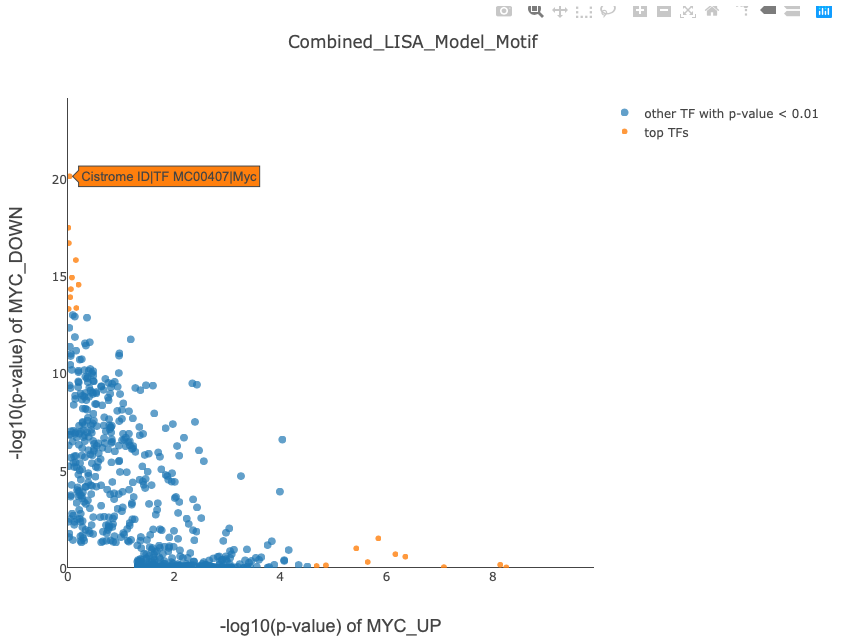
NOTE: These two figures can be saved to local disk, The x axis and y axis shows the -log10(p-value) of the TF ranking significance for either gene set. Once user moves mouse over the points, the corresponding TF ChIP-seq sample will be shown by Cistrome ID and TF name, user can see details information about the sample by searching CistromeDB with Cistrome ID.
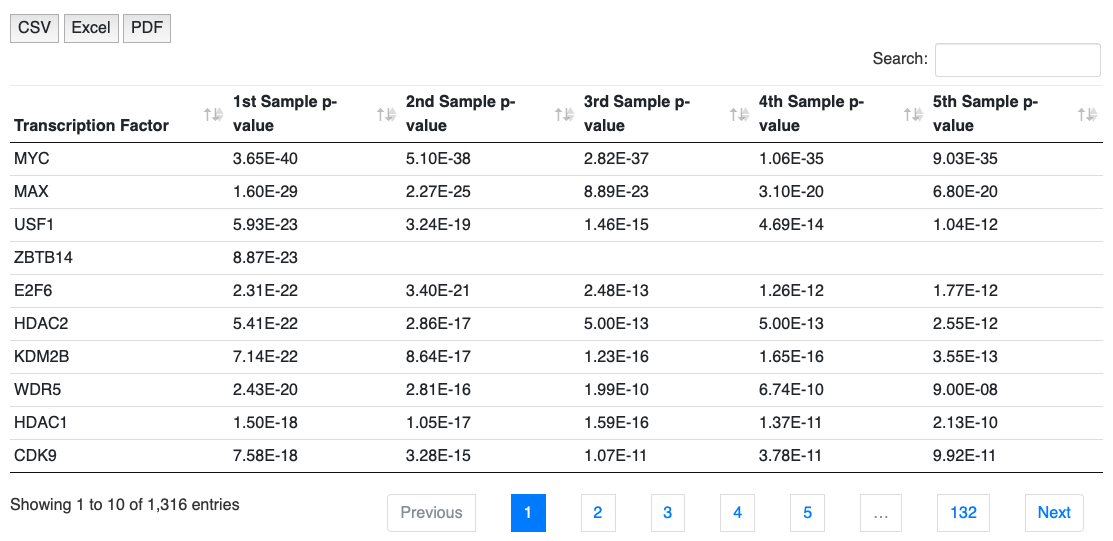
NOTE: Click on each of the p-value for TF ranking, the Cistrome dataset link will be shown below (Figure 6).
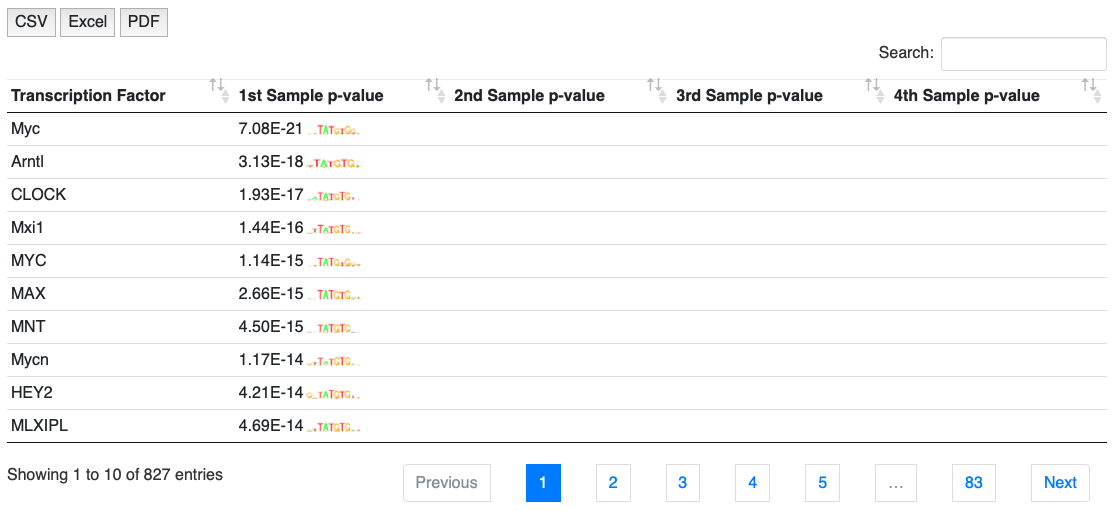
NOTE: These tables above can be exported to csv or pdf to local disk.
Local command version
Local installation
Lisa can be deployed as a command line version, which is installed using the following commands.
   ### Preparation of Anaconda environment
   wget -c https://repo.continuum.io/miniconda/Miniconda3-latest-Linux-x86_64.sh
   bash Miniconda3-latest-Linux-x86_64.sh
   export PATH="${HOME}/miniconda3/bin:$PATH"
   conda create -n lisa python=3.6 && conda config --add channels conda-forge && conda config --add channels bioconda
   conda activate lisa

   ### Installation
   conda install -c qinqian lisa
Local usage
The Lisa framework has three pipeline represented with three sub-parsers, model, multiple_fastq2bigwig, and multiple_bigwig2hdf; The TF rank method is run through the model sub-parser.
Run all the methods
   # with fixed background gene set
   time lisa model --method="all" --web=False --new_rp_h5=None --new_count_h5=None --species hg38 --epigenome "['DNase', 'H3K27ac']" --cluster=False --covariates=False --random=True --prefix background_explore --background=dynamic_auto_tad --stat_background_number=1000 --threads 8 test.gene_symbol

   # with customized gene set
   time lisa model --method="all" --web=False --new_rp_h5=None --new_count_h5=None --species hg38 --epigenome "['DNase', 'H3K27ac']" --cluster=False --covariates=False --random=True --prefix background_explore --background=background.gene_symbol --stat_step_background_number=1000 --threads 8 test.gene_symbol
Options: The test.gene_symbol is the gene set user input, which is a text file with one official gene symbol or refseq id per line, mixture of the both is not supported yet, this is used as a prefix for output, so put the file in a directory with written permission.
--epigenome option controls the histone mark, DNase-seq or both to use in the features.
--background option can specify user provided text file containing one gene a row to compare with the target gene set, --background=None to use random selected 3000 genes.
--stat_background_number specify the background genes number for wilcoxon test, usually specify 500-1000, if the --background specify user customized gene set, all of the genes will be used from the text file.
Run only one method
run only the knockout or beta (direct from TF ChIP-seq) method: --method option can control the method to run knockout or beta method or both, use it with the option --web=True to turn off the baseline method.
Local Output
Take AR.symbol input and histone mark H3K27ac as an example. By using the above command, the key results are as follows,
| Output File | Content | Instruction |
|---|---|---|
| AR.symbol.premodel_records.txt | regulatory potential cluster-based regression performance and coefficients | one row is PRAUC,AUC,lambda, 2nd row is coefficients |
| AR.symbol_motif99_baseline.csv | baseline method based on motif hit between differential & control gene | one row is motif_id|TF_name,p-value |
| AR.symbol_chipseq_baseline.csv | baseline method based on chip-seq peak hit between differential & control gene | one row is CistromeID|TF_name,p-value |
| AR.symbol.gene_symbol.DNase.coefs.csv | Regression coefficients for DNase | one row is CistromeID,coefficient,cell type, cell line, tissue |
| AR.symbol.DNase.lisa_predicted_rp.csv | predicted differential expression log probability | one row is refseq,log probability |
| AR.symbol.gene_symbol.H3K27ac.coefs.csv | Regression coefficients for H3K27ac | one row is CistromeID,coefficient,cell type, cell line, tissue |
| AR.symbol.H3K27ac.lisa_predicted_rp.csv | predicted differential expression log probability | one row is refseq,log probability |
| AR.symbol.H3K27ac.gene_set.performance | differential gene prediction | one row is AUC,PRAUC |
| AR.symbol.1000.lisa_direct.csv | BETA TF ranks based on 1000 background genes (or user customized genes) | one row is CistromeID|TF_name,p_value |
| AR.symbol.3000.lisa_direct.csv | BETA TF ranks based on 3000 background genes (or user customized genes) | one row is CistromeID|TF_name,p_value |
| AR.symbol.gene_symbol.DNase.motif99.p_value.csv | motif insilco knockout result for DNase | one row is motif_id|TF_name,p-value |
| AR.symbol.DNase.chipseq.p_value.csv | TF ChIP-seq insilco knockout result for DNase | one row is motif_id|TF_name,p-value |
| AR.symbol.gene_symbol.H3K27ac.motif99.p_value.csv | motif insilco knockout result for H3K27ac | one row is motif_id|TF_name,p-value |
| AR.symbol.H3K27ac.chipseq.p_value.csv | TF ChIP-seq insilco knockout result for H3K27ac | one row is motif_id|TF_name,p-value |
| AR.symbol_chipseq_cauchy_combine_raw.csv | Combined ChIP-seq-based TF p values by Cauchy combination test | one row is motif_id|TF_name,p_value |
| AR.symbol_chipseq_cauchy_combine_dedup.csv | Combined ChIP-seq-based TF p values removing redundant samples | one row is motif_id|TF_name,p_value |
| AR.symbol_chipseq_fisher_combine_raw.csv | Combined ChIP-seq-based TF p values by Fisher's method | one row is motif_id|TF_name,p_value |
| AR.symbol_chipseq_fisher_combine_dedup.csv | Combined ChIP-seq-based TF p values removing redundant samples | one row is motif_id|TF_name,p_value |
FAQ
How many datasets are there?
The 1st version of CistromeDB is incorporated, the dataset statistics is as the table below, NOTE: the data used for current Lisa online is updated to CistromeDB (201801).
| Category | Human | Mouse |
|---|---|---|
| DNase-seq | 1,106 | 361 |
| H3K27ac ChIP-seq | 1,544 | 1,031 |
| TF and CR ChIP-seq | 8,471 | 4,363 |